r/dataisbeautiful • u/PolarisXvi • 8h ago
OC [OC] How much of a $40 order a restaurant keeps on DoorDash, Uber Eats and its own app

677
Upvotes
r/dataisbeautiful • u/AutoModerator • 16d ago
Anybody can post a question related to data visualization or discussion in the monthly topical threads. Meta questions are fine too, but if you want a more direct line to the mods, click here
If you have a general question you need answered, or a discussion you'd like to start, feel free to make a top-level comment.
Beginners are encouraged to ask basic questions, so please be patient responding to people who might not know as much as yourself.
To view all Open Discussion threads, click here.
To view all topical threads, click here.
Want to suggest a topic? Click here.
r/dataisbeautiful • u/PolarisXvi • 8h ago
r/dataisbeautiful • u/AgileOutpost • 7h ago
Back in April 2020, during the pandemic, this post visualising dice rolls from Critical Role made it to r/all.
I had no idea at the time, but that post would send me down a six-year rabbit hole.
I went from watching Critical Role's entire second campaign, to playing TTRPGs myself, to becoming a Dungeon Master, and eventually building Recap Raven, a Discord bot that remembers campaigns and provides analytics for GMs and players.
This week I launched a TTRPG statistics page using anonymised data from games recorded on Recap Raven, and this felt like the first place I should share it.
I've already found the data useful when running my own sessions. For example, I never knew how long combat encounters typically lasted, or whether my encounters were dragging compared with other games.
But what surprised me most was the pillars of play breakdown. I expected combat to occupy a much larger share, yet exploration came out on top, followed by social interaction. Combat accounted for just 25.2% of classified play. Also, the average group plays every 12.6 days (mean).
Of course, this is a snapshot of games recorded through Recap Raven, not a representative survey of the whole hobby. I'm hoping to expand the research and track how these numbers change over time.
Does this look anything like your own sessions? And what other TTRPG statistics would you be interested in seeing?
<edit, moved full info on sources to comments>
Full data, additional statistics and methodology: https://recapraven.com/ttrpg-statistics
r/dataisbeautiful • u/Simple-Past5290 • 7h ago
Sources: Public disclosure
Made using: Adobe Illustrator
r/dataisbeautiful • u/Additional-Ant-6158 • 5h ago
r/dataisbeautiful • u/goodinvestmentio • 9h ago
I made this comparison for Good Investment, which I founded because I think people buying a home deserve better appreciation analysis than a city average. My goal is to make how homes appreciate easy to understand and open to anyone.
From 2019 to 2025, Chicago home prices rose 36.3%. Hegewisch, on the far southeast edge, rose 54.4%, while the Loop rose 0.7% and the Near North Side 8.2%.
Data: FHFA and our own index, both mapped to Chicago's community-area boundaries. Where FHFA covers most of an area's homes, the area takes FHFA's figure. Most of the central city lacks that coverage, so those areas, and the city-wide line, come from our own index. Confidence intervals are bucketed into interval ranges for high, medium, and low.
Tools: Python, pandas and NumPy for the series; GeoPandas for matching geography; Matplotlib for this chart.
Full map: https://goodinvestment.io/resources/chicago-home-prices-by-neighborhood
Free resources: https://goodinvestment.io/resources
r/dataisbeautiful • u/SashSail • 15h ago
HTTP status code 402, “Payment Required”, was reserved in the 1990s and then left almost unused. A newer standard called x402 finally puts it to work: a web API answers 402 with a price, the caller pays a small amount in USDC (a dollar-pegged token), retries, and gets the data. No account, no API key.
I run a small directory of these APIs, and its checker tries to buy from each one. This chart is the most recent attempt for every API it has tried: 4,235 of them. 58% sent back what they said they would. The group I find most interesting is the 288 that answered a payment by asking for payment again.
r/dataisbeautiful • u/StatCanada • 1d ago
🎂 Babies born on leap day (February 29) had the least common birthday in Canada from 1995 to 2025, while those born on September 20 had the most common.
Explore more live birth trends here.
---
🎂 Les personnes nées un jour bissextil (29 février) avaient la date de naissance la plus rare au Canada de 1995 à 2025, tandis que celles nées le 20 septembre avaient la plus fréquente.
Examinez d’autres tendances relatives aux naissances vivantes ici.
r/dataisbeautiful • u/Head-Manager6402 • 8h ago
r/dataisbeautiful • u/profcyclist • 1d ago
r/dataisbeautiful • u/therutvikraval • 23h ago
r/dataisbeautiful • u/jaykrown • 4h ago
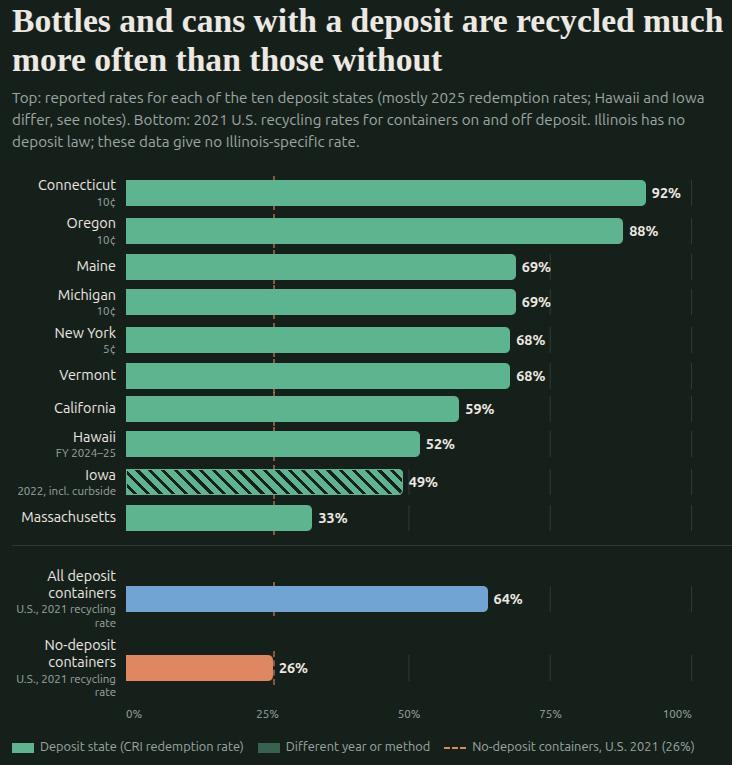
Reading this fairly. All ten deposit states are shown, not just the best ones. Their reported rates vary widely: Massachusetts is at 33%, Oregon (10¢) at 88%. Every state figure is above the 26% national non-deposit figure, but the measures and years differ, so this is not a like-for-like comparison (see below).
Different measures and years. Most state bars are calendar-year 2025 redemption rates for containers covered by each state’s deposit law; Hawaii’s is fiscal year 2024–25, and Iowa’s hatched bar is a 2022 recovery rate. The bottom two bars are 2021 U.S. recycling rates cited in CRI’s August 2026 release, and “not on deposit” includes non-deposit drinks sold inside deposit states. The bottom bars show the national gap between deposit and non-deposit containers; the state bars add context. None of this gives an Illinois-specific rate.
Connecticut rose from 65% to 92% in a year, following upgrades that included more return locations and a deposit increase from 5¢ to 10¢ in January 2024. CRI cautions that cross-border returns, claims of over-redemption by some distributors, and beverage sales that CRI estimates exceed what distributors report could all inflate the reported rate.
Iowa (hatched) is CRI’s 2022 “recovery rate,” which counts curbside and drop-off recycling as well as deposit redemptions, so it isn’t directly comparable to the redemption rates.
Sources
Tools used: Gemini, Perplexity, Claude Sonnet 5.5.
r/dataisbeautiful • u/ourworldindata • 1d ago
China is often the poster child for rapid reductions in poverty, and for good reason. In the early 1980s, over 90% of its population lived in extreme poverty, but by the early 2020s, that number had dropped to nearly zero.
Some might assume that China is the only reason why global extreme poverty has declined. But that’s wrong: many countries have seen dramatic reductions in poverty, too. Indonesia is one clear example; it’s shown alongside China on the chart.
In 1984, 86% of Indonesians lived on less than $3 per day. By 2025, this had fallen to less than 4%. While it didn’t quite match China’s decline, it has still been impressive. The number of people living in extreme poverty has fallen from 140 million to about 10 million.
Note that the international poverty line is extremely low, defined as people living on less than $3 per day. But Indonesia has also made progress when measuring higher poverty lines.
Data source: World Bank Poverty and Inequality Platform (2026)
Tools used: Python, OWID Grapher, Figma
r/dataisbeautiful • u/thoughts-and-priors • 11h ago
r/dataisbeautiful • u/illusion121 • 1d ago
r/dataisbeautiful • u/siorge • 1d ago
Hi sub,
This is the result of one month of border drawings on my game, Borderline.
You can explore the map in great details here: https://www.habibicode.org/thedrawnworld
Or add your lines to it here: https://www.habibicode.org/borderline
r/dataisbeautiful • u/Correct-Moment-2458 • 15h ago
NOAA’s estimated within-year increase in global atmospheric CO₂ fell from 3.76 ppm in 2024 to 2.06 ppm in 2025, a 45.2% smaller increase. That is still growth: the 2025 annual mean was 425.62 ppm. The bars measure start-to-end-of-year concentration change, not the difference between annual means (2.83 ppm in 2025) or emissions mass.
These are global marine-surface measurements, not Mauna Loa alone. Whiskers preserve NOAA’s reported uncertainty; recent values can be revised.
Source: NOAA GML global CO₂ data, version 2026-10. Tools: Python/pandas/Matplotlib, with ChatGPT/Codex assistance.
I run Meplar. Data and methods.
r/dataisbeautiful • u/Hefty-Example2482 • 1d ago
r/dataisbeautiful • u/tiagoantunespt • 1d ago
r/dataisbeautiful • u/rockstarinvestor • 7h ago
English: https://thelongswell.com/floods/how-a-flood-is-made/
Spanish: https://thelongswell.com/floods/asi-se-forma-una-inundacion/
Source: ERA5 reanalysis (Copernicus Climate Change Service), 2026 preliminary; AEMET station observations (Barcelona Fabra, station 0200E). Anomalies against the 1991–2020 baseline.
Tool: Built with Claude (Anthropic) as a coding assistant. It wrote the code that downloads and processes the ERA5 data and renders the maps and animations. All layers are plotted from the measured data, nothing is AI-generated imagery.
r/dataisbeautiful • u/moabusin • 1d ago
I've decided to put together data of every 'regular' (900+ minutes played) player in the Premier League, La Liga, Serie A, the Bundesliga and Ligue 1 last season, counted by nationality and divided by the population back home. The map shows Europe, and the ranking underneath is the whole world.
Croatia comes out top: 5.4 players per million people. Denmark is right behind on 5.2, then Kosovo, Spain and Uruguay, the only country outside Europe in the top ten.
The big footballing nations sit much lower once you account for size. France is 2.6, England 1.9, Germany 1.6, Argentina 1.2, and Brazil only 0.28 (37th), even though 59 Brazilians played regular minutes. The USA is last of the 45 at 0.04.
Worth saying: countries that have one of these five leagues get a boost from playing at home, which is part of why Spain ranks so high. And a country needs at least five regulars to be ranked, so Iceland (four players, 10.4 per million) isn't on the list.
Football fans, I'd love to hear your thoughts on why small countries like Croatia and Denmark keep producing so much talent relative to their size?
Data Source: It's built from 1,594 players who played at least 900 league minutes in 2025/26, with populations from the World Bank (and the UK's own figures for England, Scotland and Wales). Pulled together with The Prism, a football analytics & scouting app I'm building, and charted in Python/matplotlib.
(If you want the rest of the world, I've put an interactive version up here: every country on a world map, with every player. You can hover any country, see who its players are and sort the full table!)
r/dataisbeautiful • u/No_Jellyfish7095 • 15h ago
A 2018 study titled Talent vs Luck: The Role of Randomness in Success and Failure explored how luck and talent influence success using an agent-based model. One of its most interesting findings was that the most successful individuals in the simulation were not necessarily the most talented. Luck played a major role!
I found the study fascinating, so I decided to create my own Python simulation inspired by the model. I've shared a visualization of the results here. I also made a video discussing the original study and exploring the simulation in more detail: https://youtu.be/acE0-AxY-Ig . It's an eye-opening way to think about success.
I am interested to hear what you think about it?
r/dataisbeautiful • u/NegotiationOk7535 • 1d ago
r/dataisbeautiful • u/Correct-Moment-2458 • 1d ago
Data: UN World Population Prospects via World Bank WDI. Age-share indicators: https://data.worldbank.org/indicator/SP.POP.0014.TO.ZS and https://data.worldbank.org/indicator/SP.POP.65UP.TO.ZS . Total population selects the ten largest non-aggregate economies: https://data.worldbank.org/indicator/SP.POP.TOTL . Snapshot retrieved 14 October 2026.
Tools: Python, pandas, NumPy and Matplotlib. Each ratio divides the unrounded share aged 0–14 by the share aged 65+. Nigeria is 13.2006 and the United States 0.92994 before display rounding. A ratio of one means equal numbers in those two age groups. Countries are selected by population, then ordered by ratio. These are population estimates, not children per parent or family-size measures. No interpolation or imputation was added by this analysis.
Data license: CC BY 4.0, with World Bank additional terms: https://datacatalog.worldbank.org/public-licenses#cc-by .
Cleaned country-year CSV, original source snapshots, methodology and reproducible plotting code: https://meplar.com/datasets/country-age-profiles/