r/askmath • • Jul 12 '24

Statistics How and why is this happening?

Post image
2.1k Upvotes

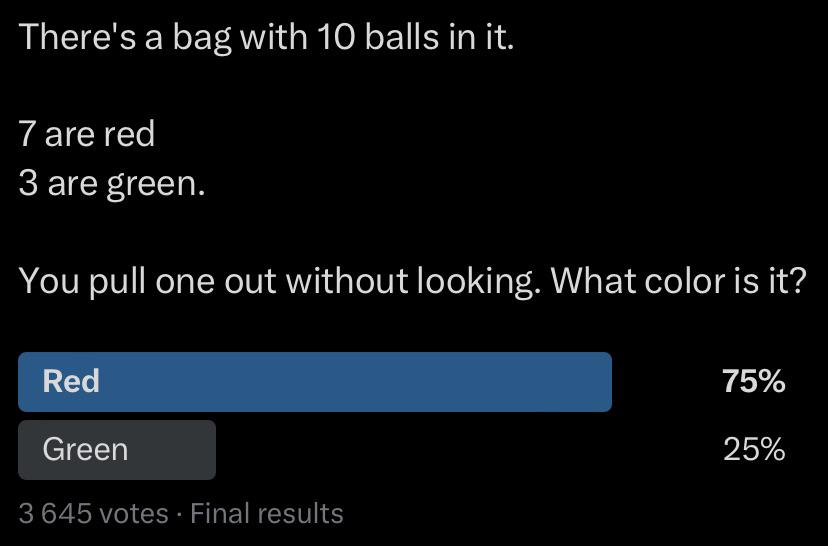
I saw this poll on X/Twitter and noticed there was also a trend for posting such polls.

I can’t figure out how and why it keeps happening, but each poll ends up representing the statistic outcome of the hypothetical test.

Is there something explaining why this occurs or it is just a strange coincidence that the poll results I saw accurately represented the statistical outcome of the test?

r/askmath • • Nov 07 '25

Statistics I was marked off by my Professor for lack of work shown. Am I crazy for thinking I showed enough work?

Post image
257 Upvotes

I used 6nCr3 because I thought it was the same as writing out 6!/3!(3!)=720/36=20. I guess I’m just confused on why my work is incorrect and am seeking clarification on where I might have messed up.

r/askmath • • 3d ago

Statistics How can a certain event have 0 probability but still be possible?

33 Upvotes

I recently started taking an introductory statistics course and we are currently learning about continuous uniform distributions.
Suppose we randomly select a real number from the interval [0,1] uniformly.
I understand that the probability of selecting a number between 0.3 and 0.8 is exactly 50%, since in uniform distribution we take the length of the interval as it's probability of happening.
But then the probability of selecting for instance 0.5 is 0, because a single point has no interval length. As we consider smaller and smaller intervals around 0.5, their probabilities approach 0.

However, to me, if an outcome is genuinely possible, it must have some probability of occuring, no matter even if it's unimaginably small. If we choose generate a random number from that interval and get 0.45432, that is one of the infinite possibilities we had, yet the probability of that happening is still 0.
I also understand the mathematical argument that we cannot assign the same positive probability to uncountably many individual numbers, because the total would exceed 1. But that still doesn't answer my question of how an outcome with exactly zero probability can actually occur.

Is there a deeper intuitive explanation for this distinction, beyond the usual point-has-zero-length analogy? Am I misunderstanding what probability actually represents?

I'd really appreciate any intuitive explanation that would help me understand this better, because my intuition completely clashes with what this concept is representing and doesn't want to accept it at all.

r/askmath • • Aug 14 '26

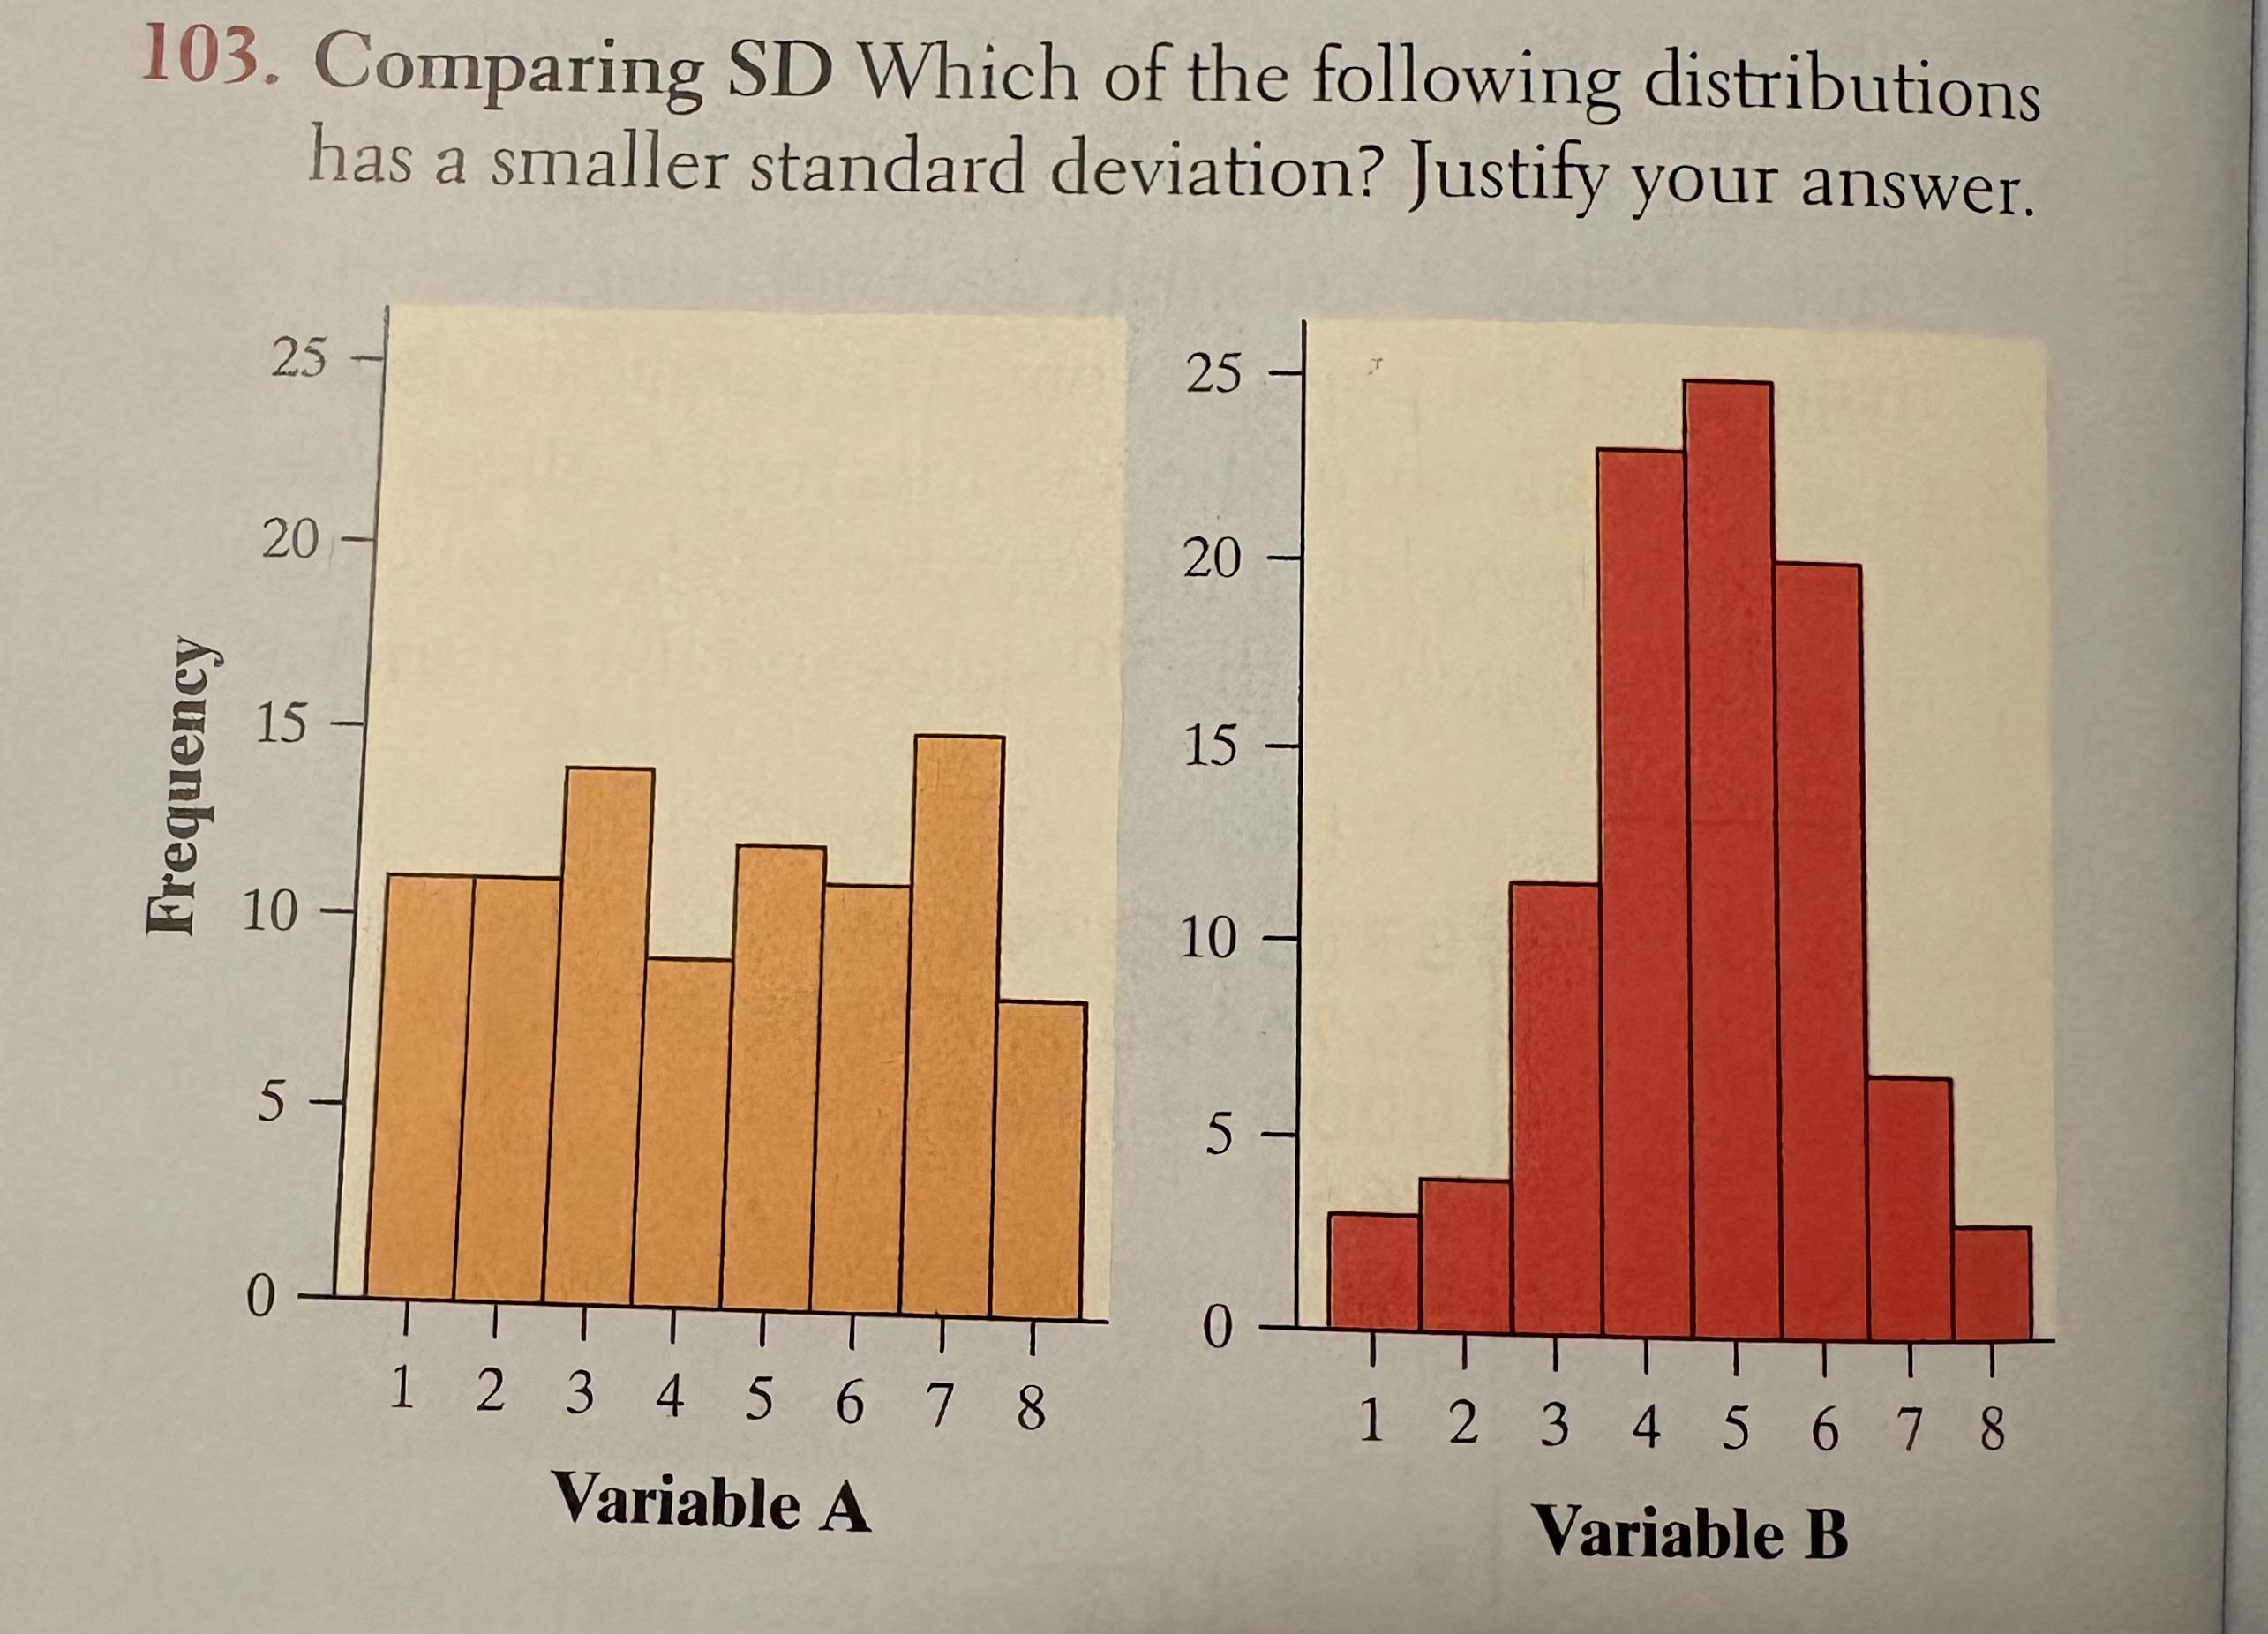
Statistics Why is the answer B?

Post image
232 Upvotes

I feel like the answer should be A, since the data is all very similar to each other, which would make it closest to the mean, making its standard deviation smaller. But the textbook says, for the exact same reasons, that B is actually the correct answer. I don’t understand why it’s B. Isn’t B more varied, and therefore has a larger standard deviation?

r/askmath • • Apr 15 '26

Statistics ELI5 who is statistically more skilled - 1st out of 100, or 100th out of 10000?

152 Upvotes

is there an equation and logic to determine the statistically superior player in this scenario?

or 10th out of 1000 , or 100th out of 10000 if that gives a different result

r/askmath • • Feb 18 '26

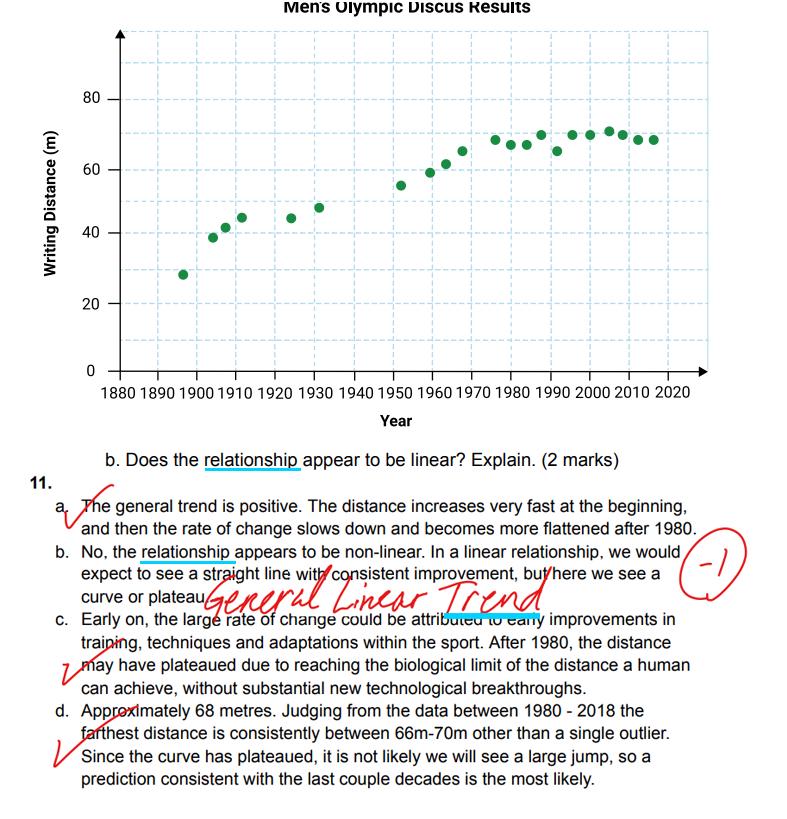
Statistics Marked wrong for calling a plateauing curve "non-linear." Am I crazy?

Post image
101 Upvotes

How can a "flattening rate of change" be marked as a linear relationship?

Despite correctly observing that the data forms a curve or plateau rather than the straight line required for a linear model. It is contradictory to explain that the progress plateaued due to biological limits (a clear non-linear behavior) while being penalized for stating the relationship is not linear.

r/askmath • • Sep 14 '26

Statistics I understand arithmetic mean and the geometric mean, but what is this harmonic mean thing?

61 Upvotes

So for both the arithmetic and the geometric mean, we're finding the "middle" value that we can repeat n times to get the same total amount.

1 + 2 + 3 + 4 + 5 = 15

arithmetic mean gives us 3, because 3 + 3 + 3 + +3 +3 = 15. Makes sense.

Same thing with geometric mean, but it handles multiplication instead of addition. multiply all the values together and take the nth root. So multiplying the result, the geometric mean, times itself n times gives us the total amount.

I see this pattern.

addition -> arithmetic mean

multiplication -> geometric mean

I don't have any concrete idea of what the harmonic mean is doing, or what kinds of operations its meant to work with.

I imagine we're doing some operation with different values, and then coming up with a single value that you could repeat the operation on, the same number of times as the original set, to get the total amount. That seems to be what "means" are.

But I don't know what operation we're talking about or how taking all these reciprocals gets us there.

r/askmath • • Mar 14 '25

Statistics On Average Who has more sisters Men or Women?

121 Upvotes

Hi guys,

Today while scrolling I accidentally bumped in to this question "on average who has more sisters men or women?" and I found it interesting to solve for those who are bored.

My first Intuition was that on average men would have more sisters since In a family where are men and women every men would have one more sister than woman. So that's why initially I thought that men on average would have more sisters,

But then I thought about families where are 10 girls for example. Those type of families would skew average amount of sisters for women.

That's why I decided to run python code. here it is:

import random
gender = ["boy", "girl"]
def generate_family(family_size):
    family_size = family_size
    family = []
    for i in range(family_size):
        family.append(random.choice(gender))
    return family
def boy_counter(family):
    boys = 0
    for sibling in family:
        if sibling == "boy":
            boys += 1
    return boys
sister_sum_for_boys = 0
boy_amount = 0
sister_sum_for_girls = 0
girl_amount = 0
for i in range(10000000):
    family = generate_family(random.randint(1, 10))
    boys = boy_counter(family)
    girls = len(family) - boys
    sister_sum_for_boys += boys*girls
    boy_amount += boys
    sister_sum_for_girls += girls*(girls-1)
    girl_amount += girls
avg_sister_for_boys = sister_sum_for_boys/boy_amount
avg_sister_for_girls = sister_sum_for_girls/girl_amount
print(avg_sister_for_girls, avg_sister_for_boys)

This code basically creates 10'000'000 families with random amount of siblings (from 1 to 10) with random amount of girls and boys in each. Then it counts average amount of sisters for boys and for girls. output was
girls on average have 3.000345284054676 amount of sisters and boys on average have 3.0001921062997887 sisters.

This experiment tells that men and women on average have equal amount of sisters. So now I'm working to mathematically prove this. If any of you guys would want to spend some time on this task would be happy to see your proof as well.

Edit: After seeing some replies I want you to consider a family where there are n number of children. let's denote amount of boys in this family as m and amount of girls as w. Every boy in this family has w amount of sister. but every girls in this family has w-1 amount of sisters since that girl herself is not counted, because a woman is not sister to herself.

If we disregard families where there are purely only girls and boys on average men would have one more sister than women. But Like I mentioned there are families with purely boys and girls. This type of families change the dynamics. This is where we need maths to find out how families with purely boys and girls would change average amount of sisters for men and women.

That's why I think that this problem is not as simple as it seems and That's why I'm trying to prove mathematically that man on average have same amount of sisters as women.

r/askmath • • Nov 02 '25

Statistics Should I play the lottery tonight?

Post image
213 Upvotes

Hey math people,

I’m in the middle of a Rummikub game with family and I think I just made statistical history.

I’ve drawn 32 tiles ( and the draw pile is now empty) and I still can’t make my initial meld.

For context: in Rummikub, you can’t start playing until you can place at least 30 points worth of valid sets (runs or groups). Normally, this happens within your first 14–20 tiles. But nope. I’ve got 32 tiles and still nothing playable.

At this point I’m convinced I’ve hit some sort of cosmic anti-luck singularity.

Can anyone here estimate how insanely unlikely this is?

Rules for reference (the 30-point rule, etc.): 🔗 https://en.wikipedia.org/wiki/Rummikub

Should I stop playing and just buy a lottery ticket tonight ?

r/askmath • • Aug 21 '25

Statistics When is median a better stat to use than average?

43 Upvotes

I just read an article on how much the average person my age has saved for retirement. The average reported was over $600,000. I did a little research further and the median is a fraction of that.

Why isn't median used a lot more often?

r/askmath • • 7d ago

Statistics McGraw Hill literally contradicting itself in its questions

Thumbnail gallery
10 Upvotes

In these two McGraw Hill questions, they literally ask the opposite things but both answers are false

  • Question 1: "A line of best fit can only be used for linear data." McGraw Hill says False (meaning you can use it for non-linear data).
  • Question 2: "A line of best fit can be used for non-linear data." McGraw Hill says False (meaning you can't use it for non-linear data).

So if I say yes it's wrong, and if I say no it's also wrong. So can anyone tell me how it works?

r/askmath • • Aug 30 '26

Statistics Monty hall problem with prior information

2 Upvotes

Hey r/askmath, my long flight layover has me thinking about the Monty Hall problem and how prior information may change the odds of getting the payout by keeping or switching.

To set the background, I understand the reasoning behind the 3-door problem, where Monty can choose deliberately to increase the odds in favour of switching, with even better odds the more doors he opens.

Where I get stuck is understanding what would happen in a scenario with "n" doors doors, where the player opens doors until the state is reduced to a 3-door problem. This can be 100, 1000, or even 1,000,000 doors.

Question 1: Assuming the player can make it to the 3-door Monty Hall problem​, how does the likelihood of payout with either choice change based on the number of doors?

Question 2: How could such a relationship be mathematically explained by Bayesian and frequentist approaches?

My thinking: If the player goes through the risk of opening n doors before the problem, even if it is random, shouldn't each door opened make it less likely the payout is in those remaining?

I understand picking the door in the beginning may be rare, but if you make it a certain amount into the game, all attempts are "lucky" if the payout is on the field, but guaranteed if it is in your door.

Bonus question: If we stop ahead of the 3-door reduction to an n-door problem, is there a set point where keeping or switching becomes better based on the doors you opened, Monty opened, and the total doors?

I have been going back and forth racking my brain for ages, so would really value some help that can finally let me rest. 😅

Edit:

For clarification:

  • Apologies if it wasn't clear, but in the n-door problem the player always picks door at the start and opens doors until his and 2 others remain. Then Monty opens one of the remaining doors. This would mean opening 1 door at n=4, or 997 at n=1000.
  • As I mentioned above, I understand any doors Monty opens intentionally not to be a car split their odds among the remaining doors.
  • The player can't open doors with knowledge.
  • I confused myself slightly with the "at risk" part. This means finding the car before getting to the 3-door problem.
  • Considering a high door number, I dont understand how the 3-door problem doesnt change, since it would be VERY unlikely for the player to make it that far unless the car is in his own door.
  • Considering the above point, I was asking what would happen to the odds assuming we know n doors are opened randomly by the player (after picking a door) before the 3-door scenario, if
  • 1. We assume they made it to that point, or
  • 2. Alternatively also taking into account the likelihood of getting there.

r/askmath • • Sep 03 '26

Statistics "Simple" statistics "paradox" I can't wrap my mind around

2 Upvotes

We meet a couple, that have two kids. But we don't meet the kids nor they say us anything about them. We have to guess if both kids are from the same gender or not. Both kids will appear in the room at the same time once we make the guess.

Probability of guessing right?

Case 1: (B&B + G&G)/(B&B + G&G + B&G + G&B) = 2/4 = 1/2 = 50%

Now, if we present the situation slightly different, so we make the guess after one of the children enters the room, and the second one enters after the guess we have:

Case 2B (pre-guess child is a boy): (B&B)/(B&B + B&G + G&B) = 1/3 = 33%

or

Case 2G (pre-guess child is a girl): (G&G)/(G&G + B&G + G&B) = 1/3 = 33%

For me probabilities are changing. But we are not really getting new information, because we already know that a child would enter before doing our guess and it would 100% either be a boy or a girl. How can I get different probabilities for the same situation?

I thought about this situation after reading the mental exercise (case 3) where they ask you the probability of a couple having a two boys, if you already know that at least one of their children is a boy. And the result was 33% just because of this reasoning. (B&B)/(B&B + B&G + G&B) = 1/3 = 33%. Why it's actually 33% here? What's different?

Can somebody explain me in a understandable way where I'm getting it wrong?

r/askmath • • 19d ago

Statistics Why I can't do math at all?

0 Upvotes

I am currently in college as a non-traditional student. I am probably the oldest student in this Stats class. The class isn't that hard, the professor is using the same exercises from the mock exam but changes the numbers. Even after practicing with that and I still scored 80/90 when the class mean was 81.24. I thought I could score an 80/80 and yet I was below the mean.

I don't know how the heck most did better than me. I thought I was doing well and I always participate in class and answer questions when my classmates struggle. Like wtf? Like I don't understand. I did study and I understood everything and did poorly. Same thing back when I was in HS, I ended up with a final transcript of like a 9/20.

I also want to add I am by myself, work a lot, get tired. I have a lot of bills to pay. I guess many of my 18 year old classmates have more time? Or do students here in the US take Stats class in HS? I feel so embarrassed that even after studying and taking the day off to do and got below the mean. I probably have some kind of math disability.

r/askmath • • Jun 01 '26

Statistics I don't understand the math paradox in cancer statistics (Incidence vs. Survival vs. Mortality)

16 Upvotes

I'm trying to wrap my head around cancer statistics, but the numbers seem to contradict each other mathematically. Could someone here explain how these three facts coexist:

  1. Lifetime risk: About 1 in 3 people (33%) will develop cancer in their lifetime.
  2. Survival rate: The 10-year survival rate is quite high, around 70-75%. (Logically, this would mean only ~10-15% of the total population should die from cancer). You must have cancer to be able to die from it...
  3. Cause of death: Yet, mortality statistics show that cancer accounts for almost 25% of all deaths in the West.

How does this equation balance out? What is the statistical nuance or "hidden variable" (like age at diagnosis or competing risks) that connects these numbers?

I understand that all of these statistics represent different groups but I can't see the connection.

r/askmath • • 12d ago

Statistics There are 52! Ways to shuffle a deck, which is already a monumentally large number. However, how many more combinations are available if after shuffling the deck, you were able to swap out one card with a random card from a second deck.

3 Upvotes

Thank you

r/askmath • • May 01 '26

Statistics Suppose that you have a dice with 1M faces. What’s the average number of rolls that you would need to get to a 1 if the dice loses all sides greater than the face?

71 Upvotes

Suppose we have a dice with 1M faces, and we play this game:

  • dice rolls, and it lands on 623,367. So all the sides from 623,368 - 1,000,000 are eliminated. Now we have a dice with 623,368 sides to it.

How many rolls do we need to get to a 1 on average?

When I do a cursory approach, the estimate is simply the base 2 logarithm of 1,000,000, which is 19.93. However some people are saying it’s more like the natural log of 1,000,000.

What do you think and why?

r/askmath • • Jun 02 '26

Statistics Picking randomly between 2 options. Odds of choosing the minority.

6 Upvotes

If we have a red button and a blue button ask a lot of people to hit it.

If everyone hits it randomly what are your odds of being part of the minority.

Is it 50/50?

And the same question but what if everyone else is not random.

r/askmath • • 29d ago

Statistics Using the least squares method for an exponential function

7 Upvotes

Hey there!

I have an experimental data set with distance and time values and I need to make a regression model for it, preferably using the least squares method.

For the y=ax+b function it's really easy and I already did it. But what about a function y=a^x+b? My idea is that you could come to the linear least squares method through substitution and logarithmic operations, but I can't really get there and understand how...

Is it possible to use the least squares method to get a regression model of a y=a^x+b function? If yes, then how? 

r/askmath • • May 15 '26

Statistics Study says 25% patients reported something, but n=6

18 Upvotes

Study says 25% patients reported something, but n=6

Help me understand who is wrong here, me or the author of this abstract yet to be presented in an academic event

They performed a surgery in 6 patients.

After that, 25% reported one thing, and 75% reported another almost unrelated thing. Is this possible? I'd expect the numbers should be 16% or 33% for 1/6 or 2/6 patients reporting that. And 66% or 87% for 4/6 or 5/6.

I don't think each patient can have half a success. Either they reported that thing or they didn't.

But to get 25% makes me think they only considered 4 patients, for some reason, and 1/4 reported that. Is there some statistics that can explain the 25% figure?

Here's the abstract, including nsfw diagrams: https://www.auajournals.org/doi/10.1097/01.JU.0001191384.77563.6d.19

Theme is somewhat funny but the math is what got me.

Edit: nsfw warning

r/askmath • • 8d ago

Statistics Need help in identifying whether or not the underlying data set is statistically significant or not. Any and all help is appreciated. I'm trying to determine, for myself, if this is best explained by random chance or by intentionality.

0 Upvotes

How statistically significant are the results of this pattern below? Does it exceed random chance or not? Assume that the numerical distributions of the numerical values per letters are completely random. 

Block 1 — ALM

Block 2 — ALM

Block 3 — ALMX

Block 4 — ALR

Block 5 — ALR

Block 6 — ALR

Block 7 — ALMR

Block 8 — ALR

Block 9 — ALR

Block 10 — KHYCX

Block 11 — TH

Block 12 — TSM

Block 13 — TS

Block 14 — TSM

Block 15 — ALM

Block 16 — ALM

Block 17 — ALM

Block 18 — ALM

Block 19 — YS

Block 20 — X

Block 21 — VM

Block 22 — VM

Block 23 — VMCSQ

Block 24 — VM

Block 25 — VM

Block 26 — VM

Block 27 — VM

Block 28 — Q

Block 29 — N

Each letter here corresponds to a certain number. It must be noted that not each letter here carries the same numerical value, these are only placeholder letters that describe the number of occurrences of said (so for example, V in Block 24 could equal 85, meaning the letter V occurs 85 times in Block 24. On the other hand, V in Block 25 could equal 173, meaning that the letter V occurs 173 times in Block 25). Once again, the numerical values are randomly chosen for each letter.

Now that out of the way, how statistically significant would such a pattern be if it emerged? Does it show signs of intentionality and design, or is better explained by random chance? Note, we’ll be specifically looking at things that constitute multiples of 19 for this demonstration (so a 1/19 chance): 

*Block 28 is a multiple of 19. 

*Blocks 21-27 (only looking at the letters VM, ignore CSQ for now) if all combined together is a multiple of 19. 

*Blocks 21-27 including CSQ (for Block 23) if combined all together is a multiple of 19. 

*Block 19 is a multiple of 19

*Block 10 is a multiple of 19

*If you combine the value X for blocks 20, 10 and 3 (only X, not any of the other values) you get a multiple of 19. 

Any and all help is appreciated. Thank you!

r/askmath • • Sep 02 '26

Statistics What are the odds of rolling a total equal to or greater than 89 with 5 D20's?

3 Upvotes

89 is my favorite number, so I was using the Google dice function with 5 D20's to roll it. Then I realized it would take me a while because the odds of rolling that or higher would be much much lower than 11/100.

I understand how to find the odds of different numbers with just 2 dice, but what about 5?

r/askmath • • 3d ago

Statistics Human predictability and the tendency towards certain patterns // Why does everyone prefer the number 7?

Thumbnail gallery
1 Upvotes

Hello everyone from r/askmath. Anyone else here interested in statistics? Actually, what I wanted to talk about also has A LOT to do with psychology and human social behavior.

A few days ago, I watched a video that introduced me to a rather strange question. According to the video, if you ask people to randomly pick any number between 1 and 10, they’re more likely to choose 7. Have you ever noticed this? Apparently, it’s also the most commonly chosen number when people are asked about their favorite number.

The explanation behind this phenomenon is that, when asked to make a random choice, people immediately rule out 1 and 10 because they’re at the extremes and don’t feel random to whoever’s making the choice. Then 5 gets ruled out because it’s right in the middle and doesn’t feel random either. After that come the even numbers, since the human brain associates a sense of order with multiples of 2 and therefore doesn’t consider them very random.

My theory is that the brain does the same thing with multiples of all integers, just to a lesser extent as the integers get larger. Therefore, odd prime numbers should be perceived by the brain as more random. We can rule out 2, since it never really became part of our intuitive understanding of prime numbers in this context, for obvious reasons.

Finally, we’re left with 3 and 7, and 3 gets picked less often because it’s smaller, so 7 wins in the end.

I didn’t find that chain of reasoning particularly convincing, so I decided to do a little experiment of my own to check whether the claim actually held up. I asked several people I know to give me a random number between 1 and 10.

Before getting into the results, I should mention that they shouldn’t be taken too seriously. Anyone with a basic understanding of statistics knows that such a small sample size, the bare minimum for this kind of analysis, isn’t enough to draw conclusions about a larger population.

As expected, 7 won, but it didn’t just get the expected majority of 45% but it blew past that figure, reaching 60%.

On top of that, 3 came in second place, which continues to support our hypothesis. The numbers at the extremes were among the least popular choices, just as predicted.

These two odd prime numbers (3 and 7), which account for only 20% of all the possible numbers, were chosen by 80% of the people. The third-place number was 6 (10%). All the remaining numbers were chosen equally often.

Of course, people might have their own perfectly valid personal reasons for loving the number 7 that have nothing to do with psychosocial patterns. But given these results, it’s clear that the majority of people who would choose 7 are incredibly predictable within this particular context.

But hey, it’s “just” a choice between 1 and 10, right?

It’s just curious to see this trait in people who say they don’t want to be part of the crowd and who tend to show a certain degree of individualism most of the time. And it’s also curious that they haven’t noticed this pattern yet... even though it’s followed by the majority and is so obvious to anyone, or at least, it should be!
r/askmath • • May 09 '26

Statistics How to do grid if more than two categories?

Post image
40 Upvotes

Ok I’m bad at describing so bear with me. The image below works if I have two categories right? But what if I need more than two? How do I do that? Like I need 7 sooo idkkk

r/askmath • • Aug 25 '26

Statistics Why divide by n-1?

16 Upvotes

To find the standard deviation, my textbook uses s=sqrt((sum if all (x-u)^2)/(n-1)). Where x-u is the distance away from the mean and n is the number of values.

I’ve been told that it means the average distance from the mean value. Which partly makes sense to me because of how you find the total of (x-u) and divide it by the number of values, n.

But why do we divide by n-1. I’ve asked ChatGPT and watched several youtube videos and they all lead to the same conclusion that it “fixes a downward bias since the denominator is bigger” and that “we don’t know what the true mean is because we are only given a sample of the population”.

Why is that when taking samples from a population, we have to divide by a smaller number, (n-1)?

And why is it always n-1? Why not n-2, n-3, n-c?

And why is n-1 in the sqrt? Wouldn’t it make sense to put it outside of the root since you are dividing the distances by the number of values?